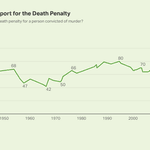


Public support for the death penalty again polled at a half-century low, with opposition remaining at its highest level since May 1966, according to the 2021 Gallup poll on Americans’ attitudes about capital punishment.
Fifty-four percent of respondents to Gallup’s annual crime survey conducted between October 1 and October 19, 2021 told the polling organization that they were “in favor of the death penalty for a person convicted of murder.” The figure was the lowest since 50% of respondents in March 1972 told Gallup they favored the death penalty. Gallup described the results as “essentially unchanged from readings over the past four years.” Support was marginally lower than the 55% reported in October 2017 and 2020, and two percentage points lower than in October 2018 and 2019.
Support for capital punishment has declined 26 percentage points from the high of 80% reported in Gallup’s September 1994 crime survey.
Forty-three percent of respondents told Gallup that they were opposed to the death penalty as a punishment for murder, matching the responses reported in the 2020 death penalty poll. Opposition to capital punishment was the highest in 55 years, since 47% of Americans expressed opposition to capital punishment in the May 1966 Gallup survey. The number was marginally higher than the 42% level of opposition reported in 2019 and two percentage points higher than in 2017 and 2018.
The results followed the continuing pattern of declining death-penalty support found in the organization’s polling. “A different death penalty question Gallup has asked occasionally, though not in the latest poll, finds lower support for the death penalty when life imprisonment with no possibility of parole is offered as an explicit alternative,” Gallup Senior Editor Jeffrey M. Jones said. “That question also shows declining support for the death penalty compared with the 1980s, 1990s and early 2000s,” Jones said.
In Gallup’s 2019 crime survey, a record-high 60% percent of Americans asked to choose whether the death penalty or life without possibility of parole “is the better penalty for murder” chose the life-sentencing option. 36% favored the death penalty.
The Demographics of Death-Penalty Support
The Gallup topline numbers found substantial differences in support for capital punishment based on a respondent’s gender, race, age, political affiliation, and political ideology. Support for capital punishment dropped among women, respondents of color, younger and older Americans, Republicans, and Democrats. Support rose among those aged 35-54, college graduates, Independents, and moderates. It remained essentially unchanged among other demographic groups.
In the 2021 poll, 59% of men said they were in favor of the death penalty (the same as in 2020), while opposition was down one percentage point to 38%. By contrast, 50% of women favored and 48% opposed capital punishment, compared with 52%–47% in 2020.
Whites favored the death penalty 59%–38%, compared to 60%–39% in 2020. Non-whites opposed capital punishment 53%–45%, up two percentage points in each category from the previous year.
Opposition to the death penalty rose by 3 percentage points among younger Americans, while support fell by 7 percentage points. 55% of respondents to the 2021 crime survey aged 18-34, said they opposed the death penalty versus 41% who expressed support. In 2020, the numbers were 52%–48%. By contrast, support for the death penalty rose among respondents aged 35-54 from 53%–44% in the 2020 survey to 58%–41% in 2021. Support for capital punishment declined slightly among Americans 55 and older from 63%–35% in 2020 to 61%–36% in 2021.
Level of education also affected views on the death penalty, although not as much as in past years. Support for the death penalty increased by 5 percentage points and opposition fell by 6 percentage points among college graduates between the 2020 and 2021 crime surveys. In the 2020 crime survey, college graduates opposed capital punishment 53%–45%; in 2021, they favored it 50%–47%. Those with some college education and those with a high school education or less both supported the death penalty 57%–41%. The numbers marked a slight decline in support, from 59%–40%, among those with some college education, but declined significantly among respondents with a high school education or less, who in 2020 supported the death penalty 62%–37%.
The greatest differences in Americans’ views continued to be along partisan and ideological lines, though support fell among both left and right while rising in the center. Support among those self-identifying remained strong, with 77% of Republicans saying they favored the death penalty, while 22% expressed opposition. However, the numbers represented a 5 percentage point shift from 2020 levels, when Republican overwhelmingly favored the death penalty by 82%–17%. Democrats underwent a comparable shift away from the death penalty, with 66% saying they opposed capital punishment versus 34% in support. In 2020, Democrats opposed the death penalty by 58%–39%. At the same time, those identifying as Independents moved in the other direction. While Independents narrowly opposed the death penalty, 50%–49% in 2020, they favored it by 55%–41% in 2021.
Those identifying themselves as conservatives were less supportive of capital punishment than those identifying as Republicans, with 70% saying they were in favor of the death penalty versus 27% saying they were opposed. That represented small declines both in support and in opposition from their views in 2020 (72%–28%). Those describing themselves as liberal opposed the death penalty, 69%–28%, up from 67%– 32% in 2020. By contrast, support for capital punishment increased among those identifying themselves as moderate by two percentage points, 57%–41%, compared to 55%-42% in 2020.